Text Processing and Classification Intro (Part 1 — Sentiment Analysis)

How to manipulate Text data to obtain more insight? How can we understand the current market sentiments through reviews?
Dealing with text data has always been an obstacle for junior data scientists that didn’t came from a tech background such as myself. On early years, we wouldn’t had an idea of how a text can be used as an input for a machine learning model. Some of us might already have an idea of converting each words in our text data into number but not quite sure on how we can convert each text into that certain numbers. This is one of many approaches that are available out there.
On this opportunity, I would like to share my experience after studying text processing for about 3 weeks. I split my writings into two parts. This part will talk about how we can analyze text data to do Sentiment Analysis. I refer to this link throughout my learning process on Sentiment Analysis.
if you want to see the text classification process directly, here’s a link the second part of my writings:
https://sea-remus.medium.com/text-processing-and-classification-intro-part-2-text-classification-9dc58782acb6
Before we begin, we should import all the essential package
import pandas as pd
import numpy as np
import sqlite3
import matplotlib.pyplot as plt
import seaborn as sns
Text data to be used
The text data that we will be using to learn on how to do text processing and classification would be a text data on Amazon Fine Food Reviews. First of all we import the data from the .sqlite file provided on the link or read the csv provided.
con = sqlite3.connect('database.sqlite')
data = pd.read_sql_query('select * from Reviews', con)
con.close()
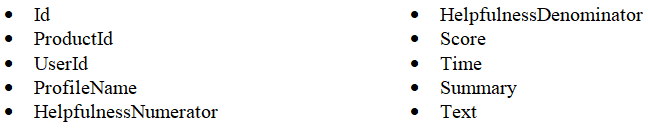
Our data contains 10 columns which are the following:
Before we begin, we clean the data so that we can evaluate which columns to use later. We try to see missing values using .isnull() and a custom function.
#check for missing values
print(data.isnull().sum())
print('\n\n\n')def checkweirddataandnull(name):
    print('='*30)
    print('Column name: '+name)
    if data[name].dtypes == 'O':
        display(data[(data[name] == 'nan')|(data[name] == 'NaN')|
                     (data[name] == 'N/A')|(data[name] == '0')|
                     (data[name] == '')|(data[name] == '-1')|
                     (data[name] == 'null')|(data[name] == 'Null')|
                     (data[name] == 'NA')|(data[name] == 'na')|
                     (data[name] == 'none')|(data[name] == 'unknown')])
    else:
        display(data[data[name] < 0])for i in data.columns:
    checkweirddataandnull(i)
Through the code above, we would see how many missing values does our data contain. It turns out that our data has several missing values on the ProfileName and the Summary columns. We handle this by imputing missing values in the ProfileName as “anonymous” and missing values in the Summary as “no summary”.
Interpreting the data
We will be evaluating the “Text” column since it contains the reviews. We will be watching for the “Score” column first since it reflects the sentiments of our customer.
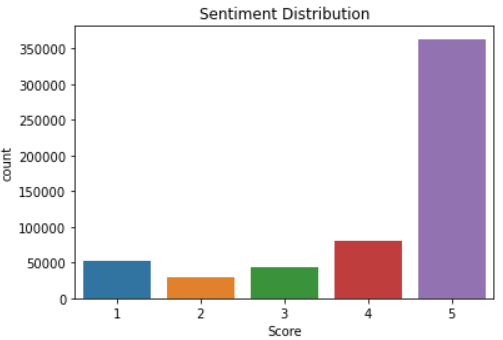
Interpreting the plot above, we can see that the sentiments of our customers tend to be positive. Most of the reviews left by customers have scores above 4. This indicates a satisfied market. From here, we would like to generate a wordcloud to better understand what words are frequently used to describe our product. To generate a good wordcloud, we need to clean our text data first so that frequently said irrelevant words are not included (e.g. conjunctions etc.).
#See what is the most used words from our data
from wordcloud import WordCloud,STOPWORDS
stpwrd = set(STOPWORDS)
stpwrd.update(['br','href']) #this is to handle should there be any HTML tags
text = ' '.join(i for i in data.Text) #this is to combine all text into one huge string.
wordcloud = WordCloud(stopwords = stpwrd).generate(text)plt.imshow(wordcloud, interpolation = 'bilinear')
plt.axis('off')
plt.show()
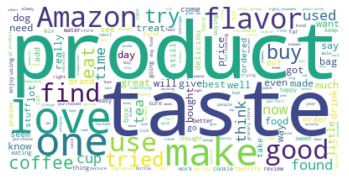
We can see that the few of the common words used in reviews were “love” and “good”. This means that the wordcloud have the same indication as the “Score” countplot shown before. The majority of our reviews are positive, assuming our customers aren’t being sarcastic. :)
Let’s try to draw wordclouds for positive, neutral and negative sentiments but adding additional stopword like “Amazon”, “product”, “one”, and “find” since it’s frequently used but feels like has no effect in differentiating sentiments. We classify reviews by looking at the “Score” column as the following:
- Positive Sentiments: 5/5 Score
- Neutral Sentiments: 4/5 Score
- Negative Sentiments: <4 Score
Assumption:
This classification is done with the considering the dataset. We can see that most of the reviews are 5/5 and some are 4/5, which means there may be customers who found the product to be quite usual and just above average but gave a score of 4/5. We will later check the validity of this assumption.
Wordclouds for each sentiments
#we update the stopwords first
stpwrd.update(['Amazon','product','one','find'])#then we draw the wordclouds for each sentiments
postext = ' '.join(i for i in data[data.Sentiments == 1].Text) #this is to combine all text into one huge string.
poswordcloud = WordCloud(width = 1600,height = 800, stopwords = stpwrd, background_color='white', random_state = 42).generate(postext)fig, (ax1, ax2, ax3) = plt.subplots(1,3,figsize = (25,25))
ax1.imshow(poswordcloud, interpolation = 'bilinear')
ax1.axis('off')
ax1.set_title('Positive Reviews Wordcloud')neutext = ' '.join(i for i in data[data.Sentiments == 0].Text) #this is to combine all text into one huge string.
neuwordcloud = WordCloud(width = 1600,height = 800,stopwords = stpwrd, background_color='white', random_state = 42).generate(neutext)ax2.imshow(neuwordcloud, interpolation = 'bilinear')
ax2.axis('off')
ax2.set_title('Neutral Reviews Wordcloud')negtext = ' '.join(i for i in data[data.Sentiments == -1].Text) #this is to combine all text into one huge string.
negwordcloud = WordCloud(width = 1600,height = 800,stopwords = stpwrd, background_color='white', random_state = 42).generate(negtext)ax3.imshow(negwordcloud, interpolation = 'bilinear')
ax3.axis('off')
ax3.set_title('Negative Reviews Wordcloud')plt.show()
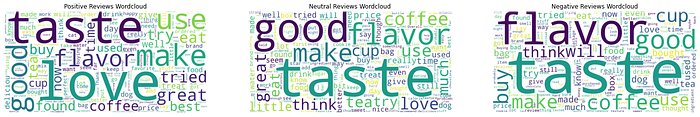
We’re having a hard time differentiating each sentiments since “taste”, “flavor”, and “good” are commonly used in each sentiments. We should update the stopwords with these words since this means that those words are quite redundant in differentiating review sentiments.
Wordclouds for each sentiments (updated)
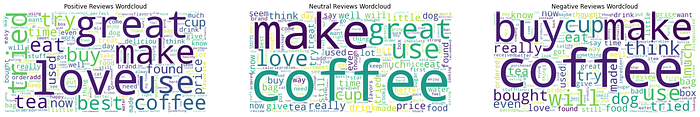
We can see that we can differentiate positive sentiments and negative sentiments since on negative sentiments there are no “love” but we cannot differentiate positive sentiments and neutral sentiments. This means our previous assumption is false. We should re-classify our sentiments into two sentiments only and we should update our stopwords with “buy”, “make”, and “coffee”.
Wordclouds after re-classifying
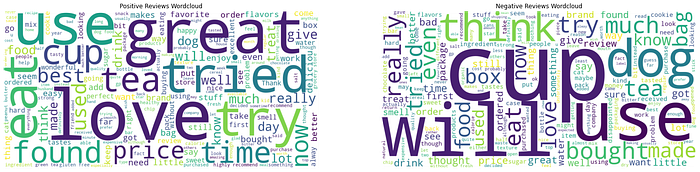
After re-classifying our sentiments into 2 class only, we can now differentiate the positive and negative sentiments of the reviews. There are additional redundant words but we won’t be updating the stopwords again since that would mean classifying positive and negative sentiments manually by seeing a bunch of wordclouds.
Additional analysis on ProductId and ProfileName
We are planning to create a classification model using text data as our input but it is also possible to add other inputs from our data to strengthen the classification model. From what I see, we could also try to engineer new variables from ProductId and ProfileName.
display(data.ProductId.value_counts())
display(data.ProfileName.value_counts())checkprodcrossname = pd.DataFrame(data.groupby(['ProductId','ProfileName']).size()).reset_index()
display(checkprodcrossname)print('\n\n\n Check whether it has a count more than 1 or not')
display(checkprodcrossname[checkprodcrossname[0] > 1])

We can definitely see a couple of things here:
- Some products got reviews more often than other products.
- Some users wrote reviews more often than any other users.
- Some products received multiple reviews from the same user.
This means that we can engineer a variable that counts the number of reviews in a product, frequency of a user writing reviews, and finally the number of user that has wrote several reviews on the same product.
Conclusion
Wordclouds can be a huge help to understand the sentiments of our customers’ comments/reviews. On this opportunity, I didn’t analyze the “Summary” column since some customers didn’t leave a summary of their reviews and I think it’s more direct if we just analyze the “Text” review. On other occasion though, we could try to use “Summary” as the text classification input.
I hope my writing didn’t bore you as I’m trying to just write the important parts. As usual, I hope you comment below should there be any critics and insights since the writing is not perfect and in fact might have lots of flaws that I may overlooked.
Next Part
So as mentioned before, we continue with text classification to predict the sentiment of new incoming reviews. We will cover this in the next part of my writing and the link is as follows:
https://sea-remus.medium.com/text-processing-and-classification-intro-part-2-text-classification-9dc58782acb6
See you there! ;)

